In this post, we will build a Live Dashboard using Power BI. You can find the client’s source code on GitHub: https://github.com/codedebate/Samples-FakeHeartMonitor.
Step 1: Let’s agree on the scope of our sample
Since our target is to build a Live Dashboard using Power BI, we will need a data source that keeps on generating our sample’s live data aka an Event Publisher. Below is an animated GIF screenshot of a Universal Windows Application that I built for this post. In a nutshell, it will fake a heart monitor readings for three different patients.
Sample client to generate our data stream
The code is very simple, I just used a DispatcherTimer to generate new random readings every second between 80 and 95. Once those are generated, they will be relayed using Azure Service Bus Event Hub and Azure Stream Analytics to our Dashboard in Power BI.
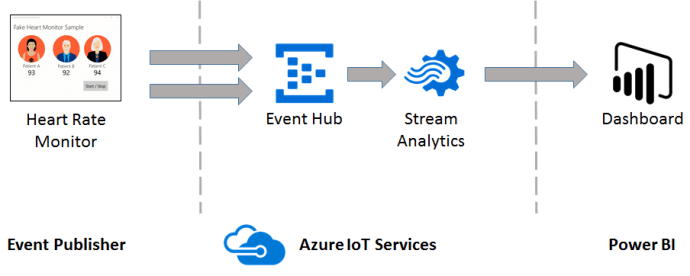
Fake Heart Beat Rate Monitor Solution
Step 2: Provision Event Hub and Stream Analytics resources in Azure
As described in the previous diagram the fake heart monitor will push the heart rate readings to Event Hub where Stream Analytics pushes it into Power BI. We will start by creating our sample’s Resource Group. Login to the Azure portal and create a new one. I called it CodeDebate-FakeHeartMonitor.
Create a new Event Hubs resource and call it FakeHeartMonitor. Once done, add our first Event Hub and call it FakeHeartMonitorHubSample like the screenshot below.
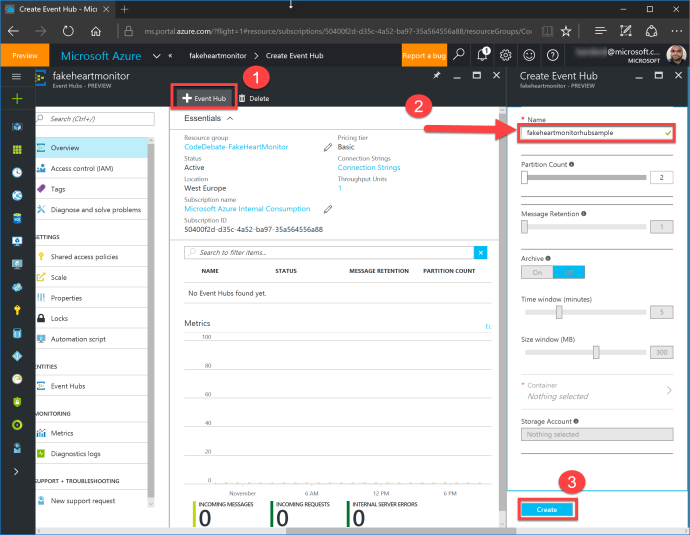
New Event Hub
Next, we need to create a new Stream Analytics Job. I called the resource FakeHeartMonitorAnalytics. We will configure it later in Step 4. For now, you should have one resource group with 2 resources: FakeHeartMonitor (Event Hubs) and FakeHeartMonitorAnalytics (Stream Analytics Job). See the screenshot below.
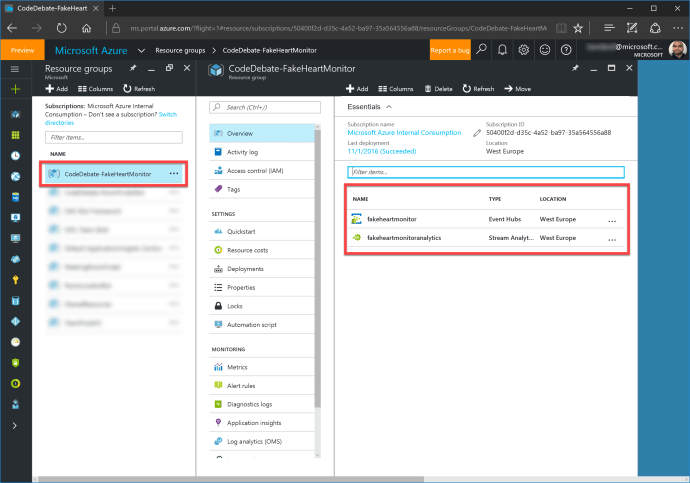
Sample Resource Group
Step 3: Connect our sample client (event publisher) to Event Hub
Before moving to Visual Studio, you need the Event Hub connection string. Navigate through the FakeHeartMonitor Even Hubs resource blade and click on Shared Access Policies. Check out the screenshot below. The connection string will be used by the Event Hub client to send the fake heart rate readings to Event Hub.
Note: In real life, you will have to create a Shared Access Policy for the specific Event Hub with a Send permission only.
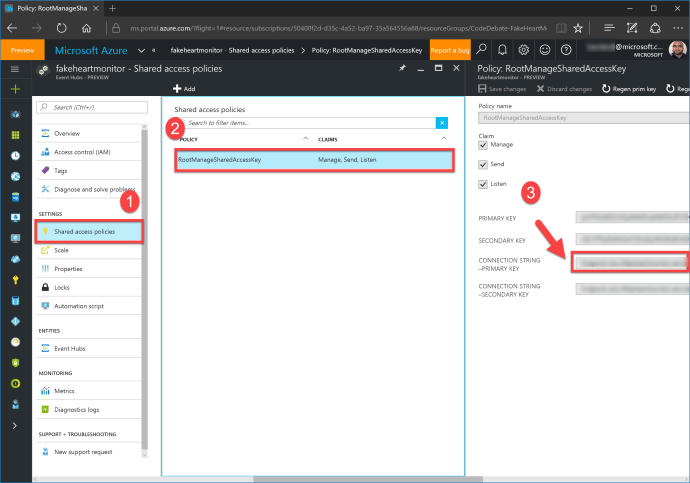
Event Hubs resource connection string
In your client project aka the Event Publisher, add the Microsoft Azure Service Bus NuGet Library. The NuGet library will help you connect to Event Hub using the Event Hub Client. For more information about publishing events, check out Azure Event Hubs Overview article.
Note: If you are using a Universal Windows Application template, then the SDK will not work (at least not yet), instead you will have to use the REST API end point. Check out the Calling the Azure Event Hub REST-API – from UWP, WPF and any other .NET (Core) Client article for an overview. I used the author’s tool (Azure Event Hub Rest Client Generator) to generate the HttpClient code/call.
I have pasted below the source code used to generate and publish the heart beat rates. Notice how I have created a Class definition called HeartBeatRateReading for the brokered message content we are sending and serialized it using Json.NET NuGet Library. The message content entity will contain the following properties:
- PatientIdentifier: Will be used to distinguish the owner of a specific heart beat rate
- HeartBeatRateValue: The value of the number of heart beats per minute for a specific patient
I have not added a TimeStamp field because Event Hub will add one for me automatically as soon as the event reaches Azure.
namespace CodeDebate.Samples.FakeHeartMonitor.Entities
{
    public class HeartBeatRateReading
    {
        public string PatientIdentifier { get; set; }
        public int HeartBeatRateValue { get; set; }
    }
}
using System;
using System.Net.Http;
using System.Text;
using Windows.UI.Xaml;
using Windows.UI.Xaml.Controls;
using CodeDebate.Samples.FakeHeartMonitor.Entities;
using Newtonsoft.Json;

namespace CodeDebate.Samples.FakeHeartMonitor
{
    public sealed partial class MainPage : Page
    {
        private const string SharedAccessSignature = "PLACE HOLDER";

        private const string EventHubRestUri = "PLACE HOLDER";

        private readonly DispatcherTimer _dtimer;
        private bool _running;

        public MainPage()
        {
            InitializeComponent();

            _dtimer = new DispatcherTimer {Interval = TimeSpan.FromSeconds(1)};

            _dtimer.Tick += Dtimer_Tick;
        }

        private void Dtimer_Tick(object sender, object e)
        {
            var random = new Random();

            var patientA = new HeartBeatRateReading
            {
                PatientIdentifier = "Patient A",
                HeartBeatRateValue = random.Next(80, 95)
            };

            var patientB = new HeartBeatRateReading
            {
                PatientIdentifier = "Patient B",
                HeartBeatRateValue = random.Next(80, 95)
            };

            var patientC = new HeartBeatRateReading
            {
                PatientIdentifier = "Patient C",
                HeartBeatRateValue = random.Next(80, 95)
            };

            PatientAHeartRateLabel.Text = patientA.HeartBeatRateValue.ToString();
            PatientBHeartRateLabel.Text = patientB.HeartBeatRateValue.ToString();
            PatientCHeartRateLabel.Text = patientC.HeartBeatRateValue.ToString();

            PublishEvent(JsonConvert.SerializeObject(patientA));
            PublishEvent(JsonConvert.SerializeObject(patientB));
            PublishEvent(JsonConvert.SerializeObject(patientC));
        }

        private void StartStopButton_OnClick(object sender, RoutedEventArgs e)
        {
            _running = _running != true;

            if (_running)
                _dtimer.Start();
            else
                _dtimer.Stop();
        }

        private static void PublishEvent(string jsonContent)
        {
            var httpClient = new HttpClient();

            httpClient.DefaultRequestHeaders.TryAddWithoutValidation("Authorization", SharedAccessSignature);

            var content = new StringContent(jsonContent, Encoding.UTF8, "application/json");
            content.Headers.Add("ContentType", "application/json");

            httpClient.PostAsync(EventHubRestUri, content);
        }
    }
}
Step 4: Configure Stream Analytics
Stream Analytics Jobs are awesome for processing Data in Motion aka Hot Path Analysis before reaching cold storage. Since we do not have any business logic or in need of Time Windows, we will use a pass-through query that uses Event Hub as the source and a Power BI data set as the sink.
The screenshot below describes the creation of a new input. I called it HeartBeatRateReadings. Make sure the Source is Event Hub and that you have selected the correct namespace.
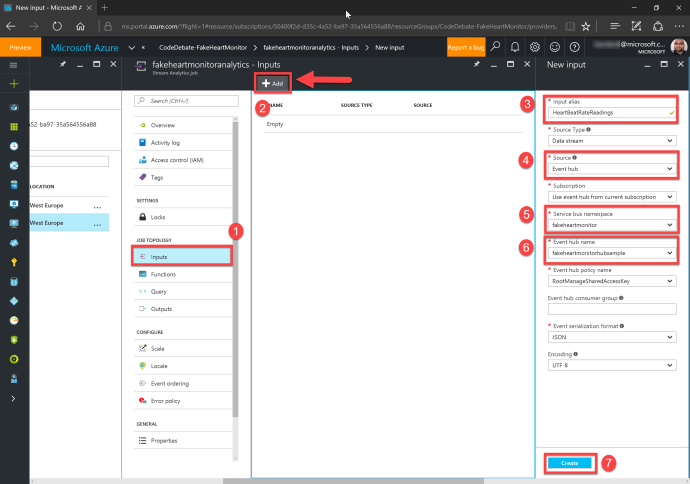
Create a new Event Hub input
Next, we need to define the output. In our sample’s case, it will be a Power BI Data Set. I called it PowerBIDasboard – yes I am fully aware of the typo 😉 Make sure the Sink is set to Power BI.
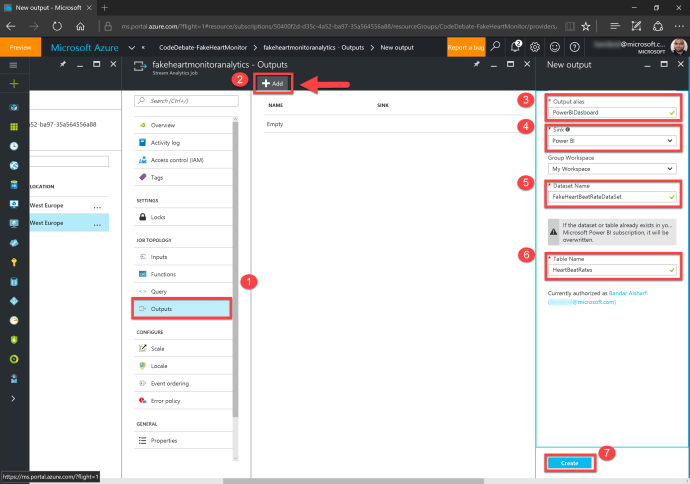
Create a new Power BI sink
Finally, we need to configure the pass-through query.
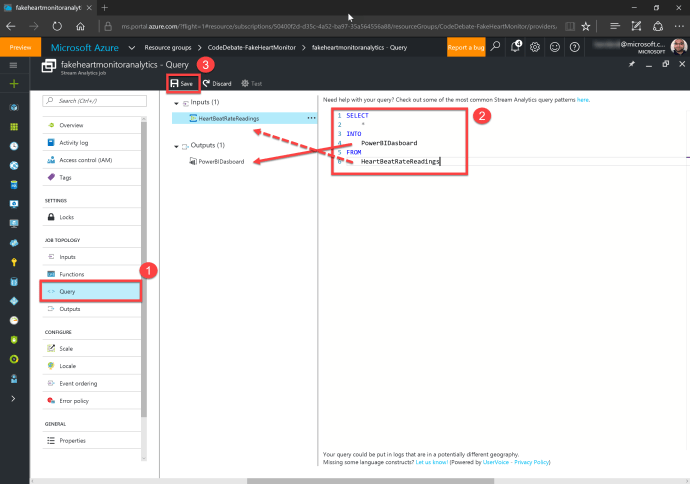
Edit the pass-through Query
Once saved, go back to the Overview blade and start the Stream Analytics Job.
Step 5: Create the Power BI Report
Run the event publisher and click Start. Now navigate to Power BI. Notice how a new data set was created automatically with name we specified in the Stream Analytics Job.
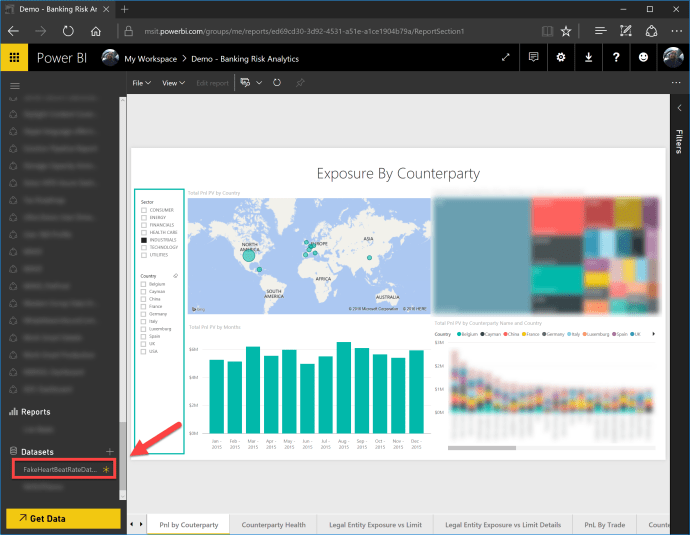
Automatic creation of the data set
Clicking on the data set will create a new draft report. Customize the report using the screenshot below as a reference. Once you are done, save it into a new dashboard.
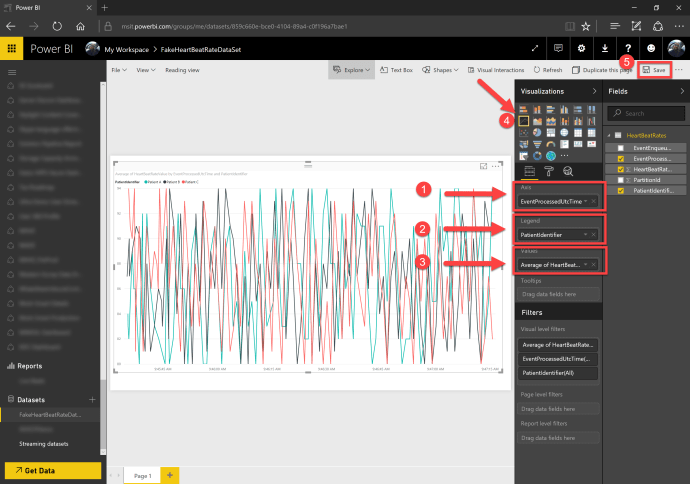
Customize and save the report
Step 6: Use the QA feature to bring dashboard to live
Open the newly created dashboard and click on the static report tile Title. The Power BI Q&A mode will be displayed.
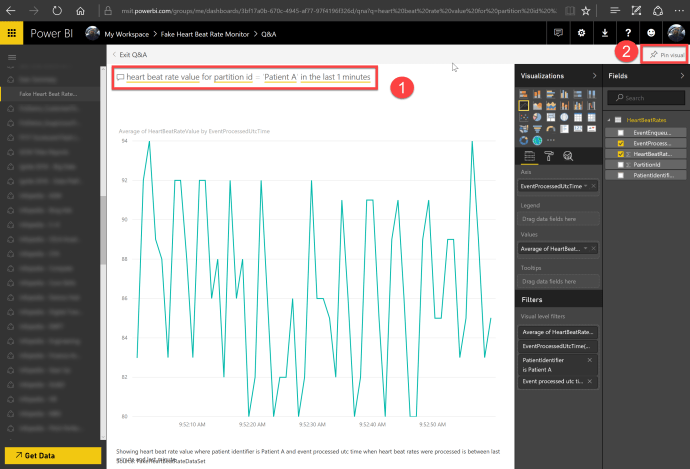
Use Power BI Q&A Feature
You can use natural language here to edit our query. The trick for having a live dashboard, is forcing your tile into a dynamic refresh mode e.g. asking about a value which is tied up to a time frame. In our sample here, we are asking for the average heart beat rate for a specific patient with in a specific time slot that is continuously changing. So last minute will change every minute 😉
Note: Make sure you click on the Pin Visual button afterwards. If you do not do so, the tile will remain static and will only refresh using the Refresh button.
Below is an animated GIF screenshot of the live dashboard we created.
Fake Heart Beat Rates Live Dashboard
Note that you can use multiple live tiles within a dashboard. Below is a screenshot of a live dashboard we demoed to one of our customers. This one however, was connected to a real medical rated device. The device was attached to one of my colleagues. He was jumping, doing push ups, and waving both hands. It was one hilarious demo 😀
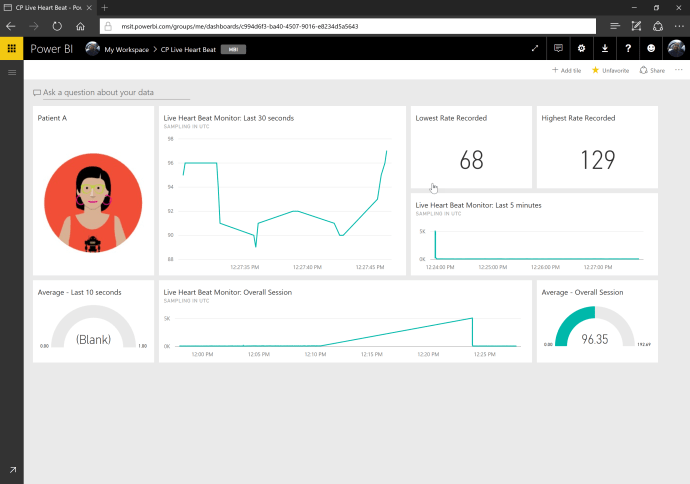
Multiple live tiles in a single dashboard
So what’s next?
Power BI is a very powerful tool for visualizing and reporting data. With the Power BI Q&A feature, you can create live dashboards that can auto refresh. If you enjoy working with analytics, I suggest going through the Big Data and Business Analytics Immersion course on Microsoft Virtual Academy.
